Machines that warn you before they break
We turn the data your machines already produce into early warnings, so repairs are planned instead of sudden.
Our plan for a 150-person plant with 25 machines
- from kickoff to first value
- 6–8 weeks
- estimated payback*
- Month 4
- saved a year, estimated*
- $130k
* Estimates from the illustrative maths in chapter 07; we confirm your real figures in a discovery call.
- Industry
- Manufacturing
- Solution
- Predictive maintenance
- What we build
- Anomaly detection
- People in control
- Every decision
- First value
- 6–8 weeks
- Payback
- Month 4*
The problem
A breakdown stops more than one machine
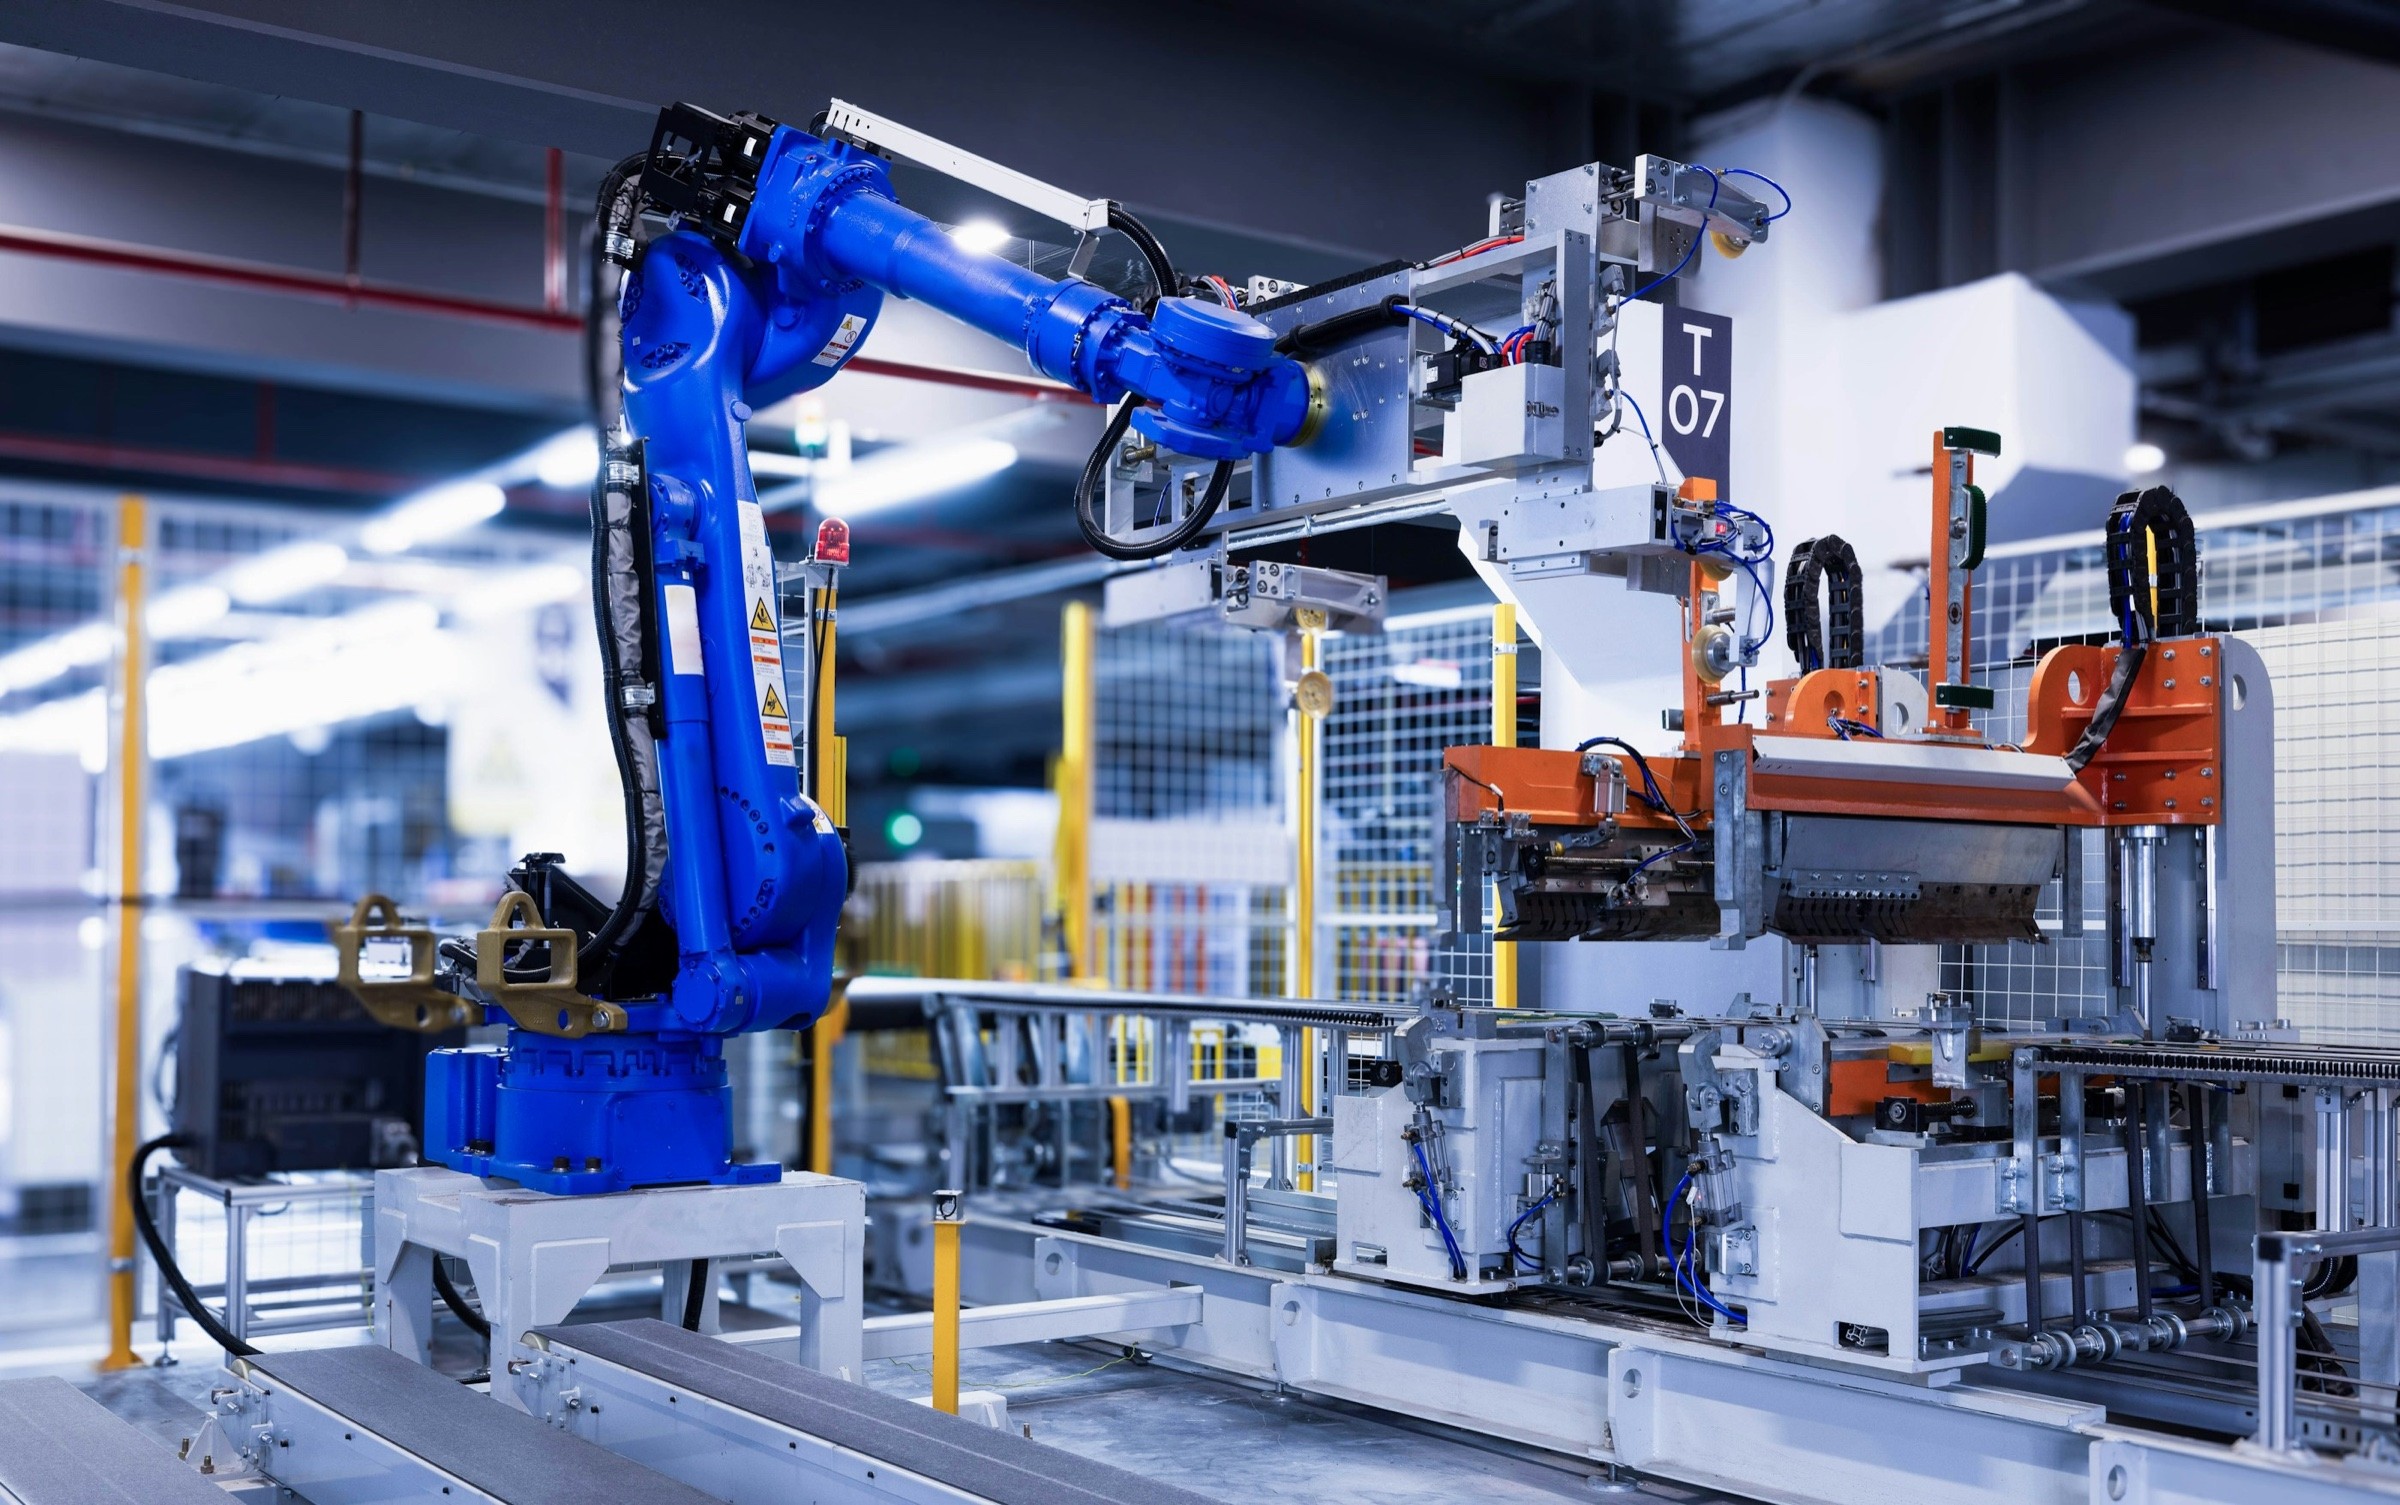
When a spindle, pump or motor fails without warning, the line stops, orders slip and the repair is always urgent: overtime, express parts and idle people. Most of these failures give signals days before; nobody is watching them.
- Repairs are reactive, never planned
- Spare parts are rushed in at a premium
- Orders slip when one machine stops
- Machine data is logged, but nobody reads it
Why we know it works
The approach is proven at scale
We build on methods that have already worked for large companies, and size them for a growing business. The evidence we draw on, as reported by BlueScope:
Since 2022 BlueScope has used AI-based predictive maintenance across several of its manufacturing sites. At dairy maker Sachsenmilch, a single early warning on a failing pump avoided costs Siemens put in the low six figures. Across the World Economic Forum’s Global Lighthouse factories, which combine AI, automation and new ways of working, the average productivity gain is around 40%.
- of unplanned downtime avoided at BlueScope in three years
- ~0 h
- complete process stops prevented
- 0
- average productivity gain at WEF Lighthouse factories
- ~0%
Figures as reported by Siemens (BlueScope, Sachsenmilch) and by the World Economic Forum from its sites’ own reports; not independently audited.
See it work
Watch a failure get caught early
An illustrative month on a line of four machines with our system running. One spindle starts to wear: our model sees the vibration drift past normal and raises an alert days before it would have failed.
CNC 1
96%
Healthy
CNC 2
94%
Healthy
CNC 3 · spindle
95%
Healthy
CNC 4
91%
Healthy
CNC 3 · spindle vibration
Day 0 of 30
Breakdown · line stopped 6 h, rush parts
Planned repair · 30 min in a planned stop
How we solve it
Your data, an AI that understands it, and people in control
The same idea, sized for a growing business: we connect to what you already have, put the AI in the middle, and keep a person in charge of every decision that matters.
- 01
Your data
- Machine controller logs
- Vibration and temperature sensors
- Maintenance history
- ERP work orders
- 02
Anomaly detection
Learns what normal looks like for each machine, and spots the drift that comes before a failure.
- 03
Your workflow
An alert with the likely cause and the part to check becomes a planned work order.
- 04
Your people
The maintenance lead schedules the repair into the next planned stop.
How we build it
First value in 6–8 weeks
One problem, a fixed scope and a clear plan. You see it working on your own data before it goes live.
DiscoverWeek 1
We walk the line with your team and list the machines that stop most, and what each one already records.
Connect the dataWeeks 2–3
We join controller logs, sensors and maintenance history into one clean timeline. Nothing new on the machines.
Train and proveWeeks 3–5
We train the model on each machine’s normal and test it against last year’s breakdowns before it goes live.
Go liveWeek 6
We switch on alerts to your maintenance lead, with the reason and the part, and review them together weekly.
ImproveWeeks 7–10
We retrain every month and add the next machines once the first ones prove it.
What you need to start
Less than most plants think
No new machines and, usually, no new sensors. Most of what the model needs is already being recorded.
Machines with controllers
CNCs, presses and pumps with a PLC or controller that logs readings, or a sensor we can add for a few hundred dollars.
Some history
A few months of readings and your maintenance log, so the model learns what normal looks like.
One owner
A maintenance lead who acts on the alerts and tells us which ones were right.
Where the savings come from
The maths, line by line
An illustrative example with stated assumptions, so you can put in your own numbers. We confirm the real figures together in a discovery call.
$130k
saved a year
A 150-person plant with 25 machines
Illustrative · assumptions- Unplanned stops a month
- 3
- Hours lost per stop
- 6 h
- Output lost per hour
- $1,500
- Cost of stops a month
- $27,000
- Stops prevented (assumption)
- 40%
The J-curve
A small dip, then compounding growth
Research on new technologies finds the same pattern: value dips while you invest in data, process and training, then climbs well past where you started. We keep the dip small by starting with one problem and paying back fast.
* Shape after Brynjolfsson, Rock & Syverson (2021); the payback month is illustrative.
What comes next
Where this is heading
- 01
From warning to action
AI agents that raise the work order, check stock and order the part themselves, for a person to approve.
- 02
A live model of the line
Digital twins that test a schedule or a setting change before it touches a real machine.
- 03
Energy from the same data
The sensor data that predicts failures also shows where energy is wasted.
Facing the same problem?
A free consultation maps where this would pay back fastest in your business.
Sources
Next case study · Logistics
Fewer miles for every delivery
Let's build what's next for your business.
Tell us what's slowing you down. We'll show you where AI, automation, software and data will make the biggest difference, and what to do first.
- Free consultation
- Your workflows reviewed by a specialist
- Clear next steps, no commitment
Working across time zones · Live
- ----San Francisco
- ----New York
- ----London
- ----Dubai
- ----Sydney